Collisions: 452,897 rows | Years: [np.int64(2015), np.int64(2016), np.int64(2017), np.int64(2018), np.int64(2019), np.int64(2020), np.int64(2021), np.int64(2022), np.int64(2023), np.int64(2024)] | Cols: 48Collision EDA — STATS19
Exploratory analysis of STATS19 collision records, including temporal, severity, road-type, and spatial patterns relevant to modelling.
1 Overview
This page explores the raw STATS19 collision records for the expanded study area (Northern and Central England) before any spatial joining or modelling. The goal is to understand the coverage, quality, and structure of the outcome variable.
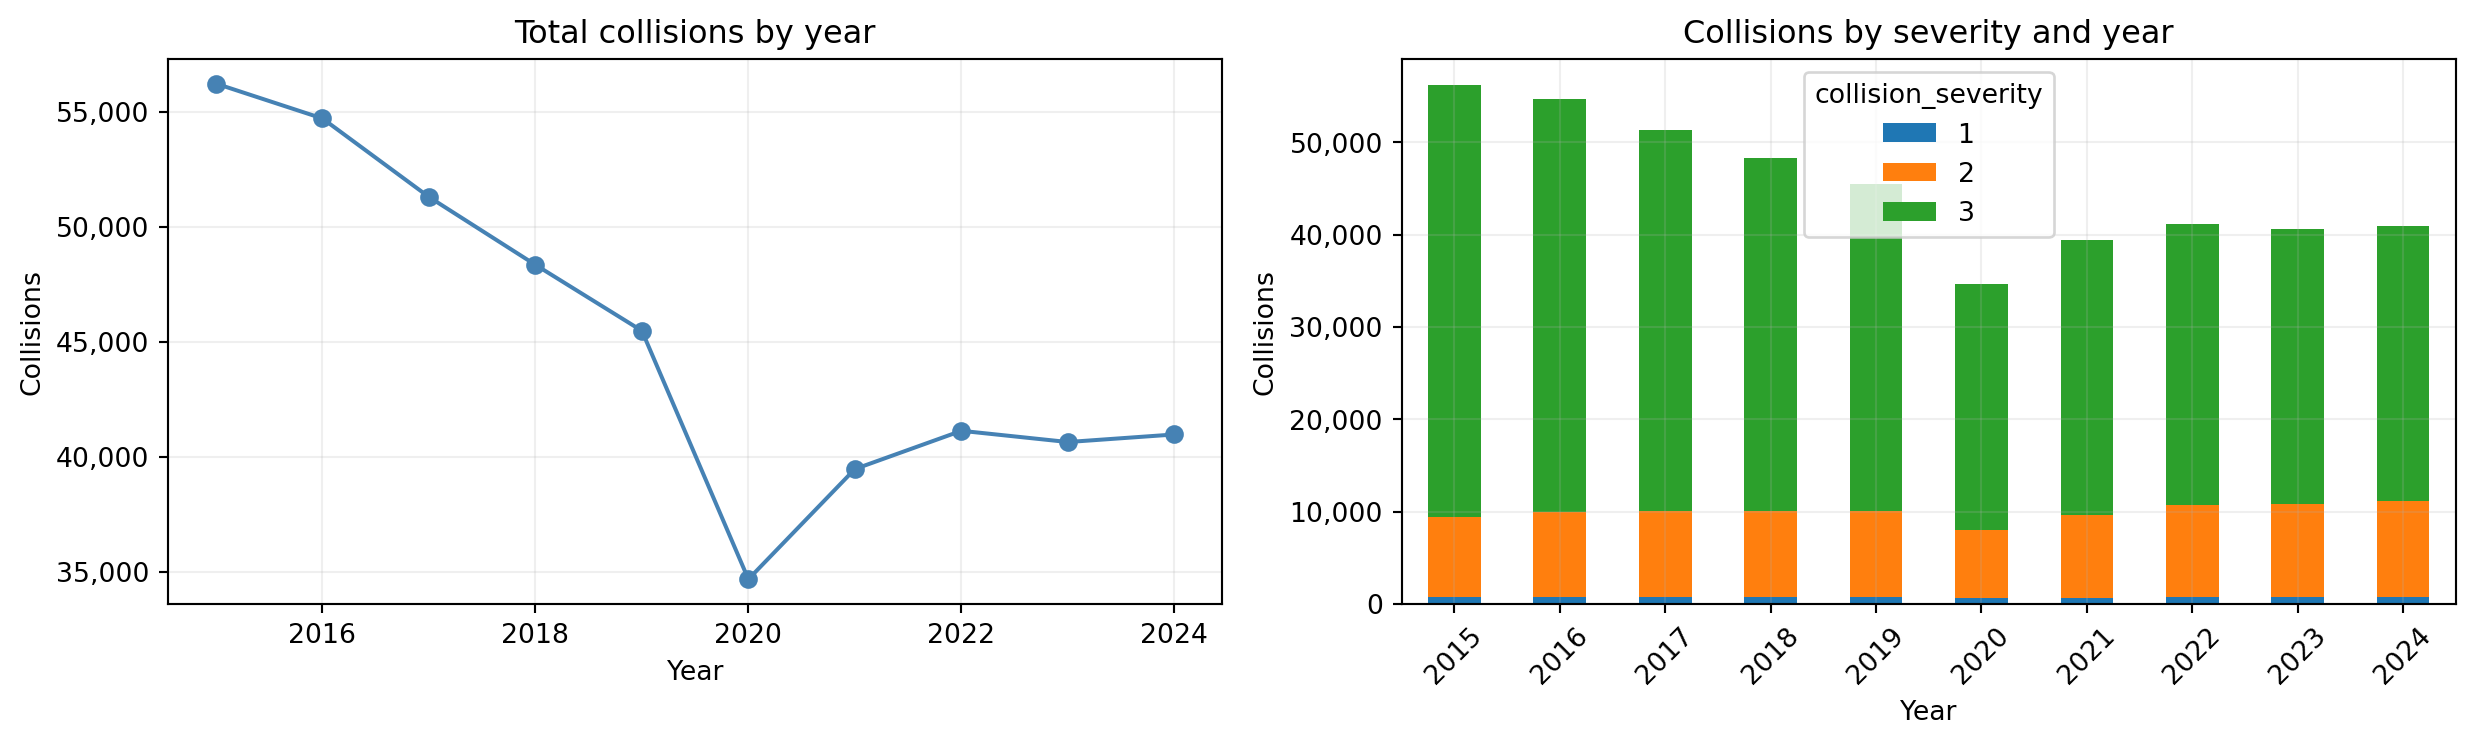
Note
The sharp drop in 2020–2021 reflects COVID-19 lockdowns reducing traffic and reported collisions. Both years are flagged is_covid = True and treated separately where needed.
2 Severity distribution
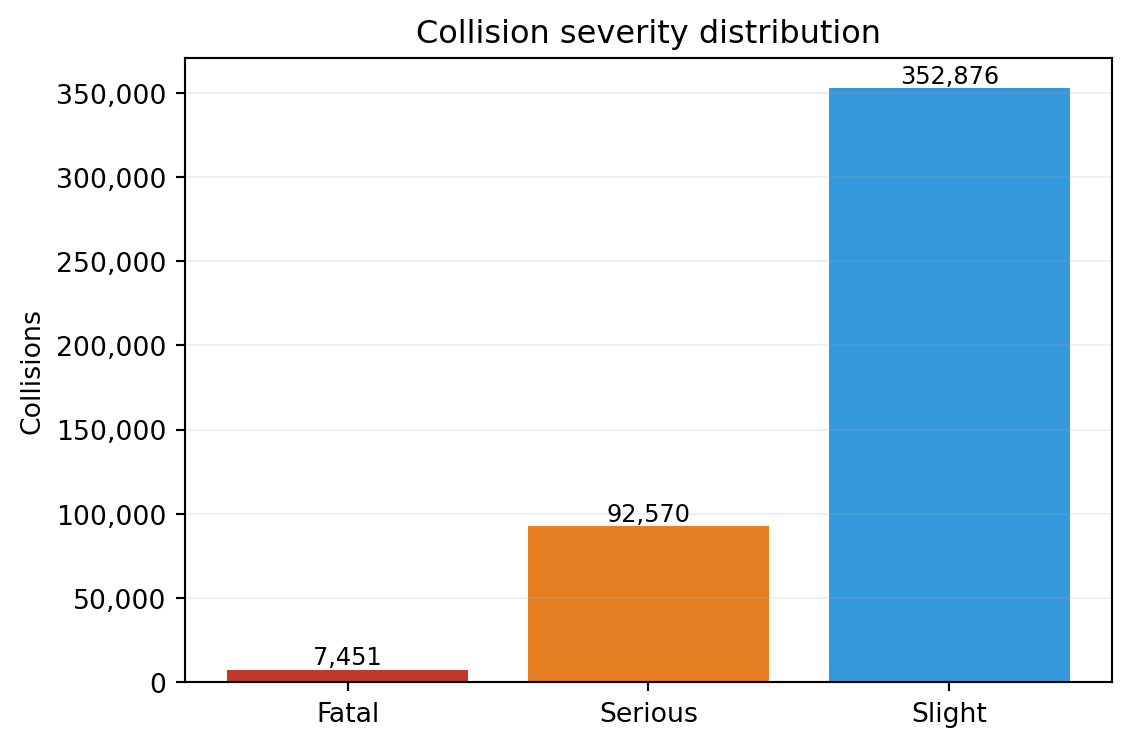
  Fatal   : 7,451 (1.6%)
  Serious : 92,570 (20.4%)
  Slight  : 352,876 (77.9%)
3 Temporal patterns
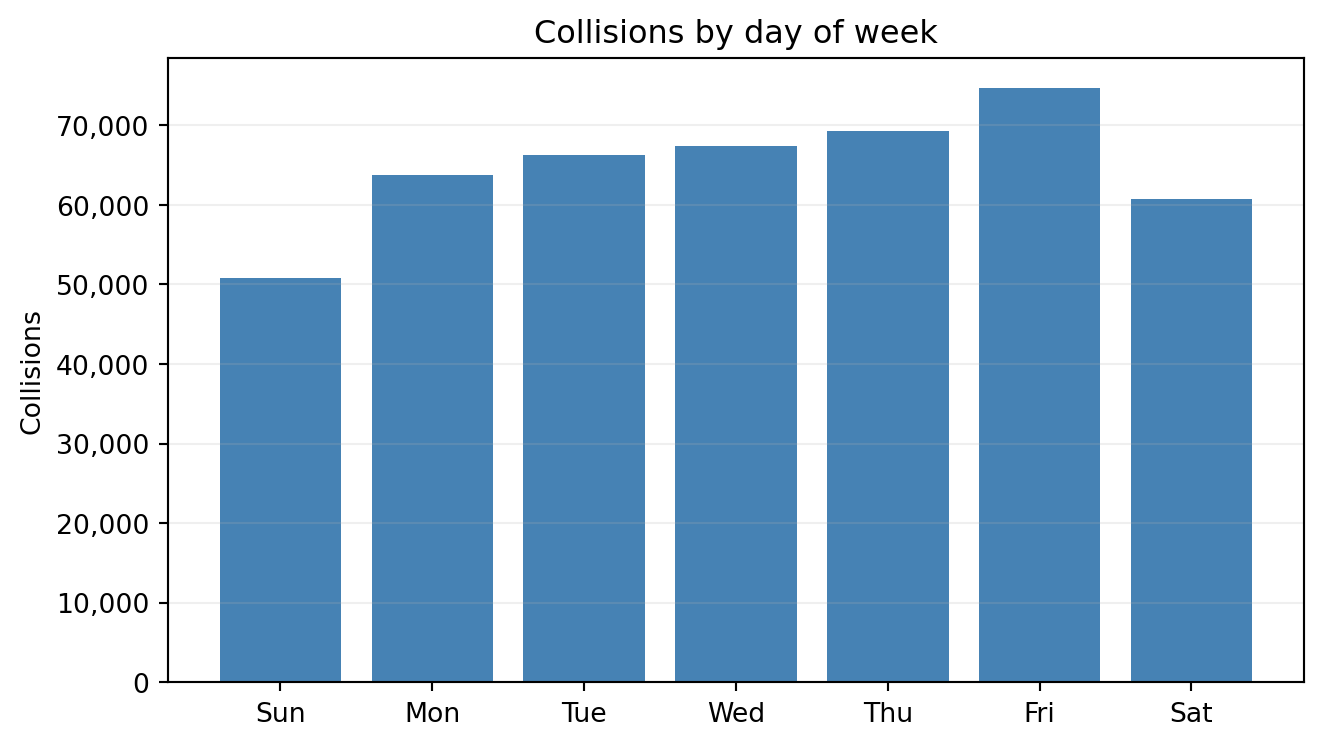
3.1 By day of week
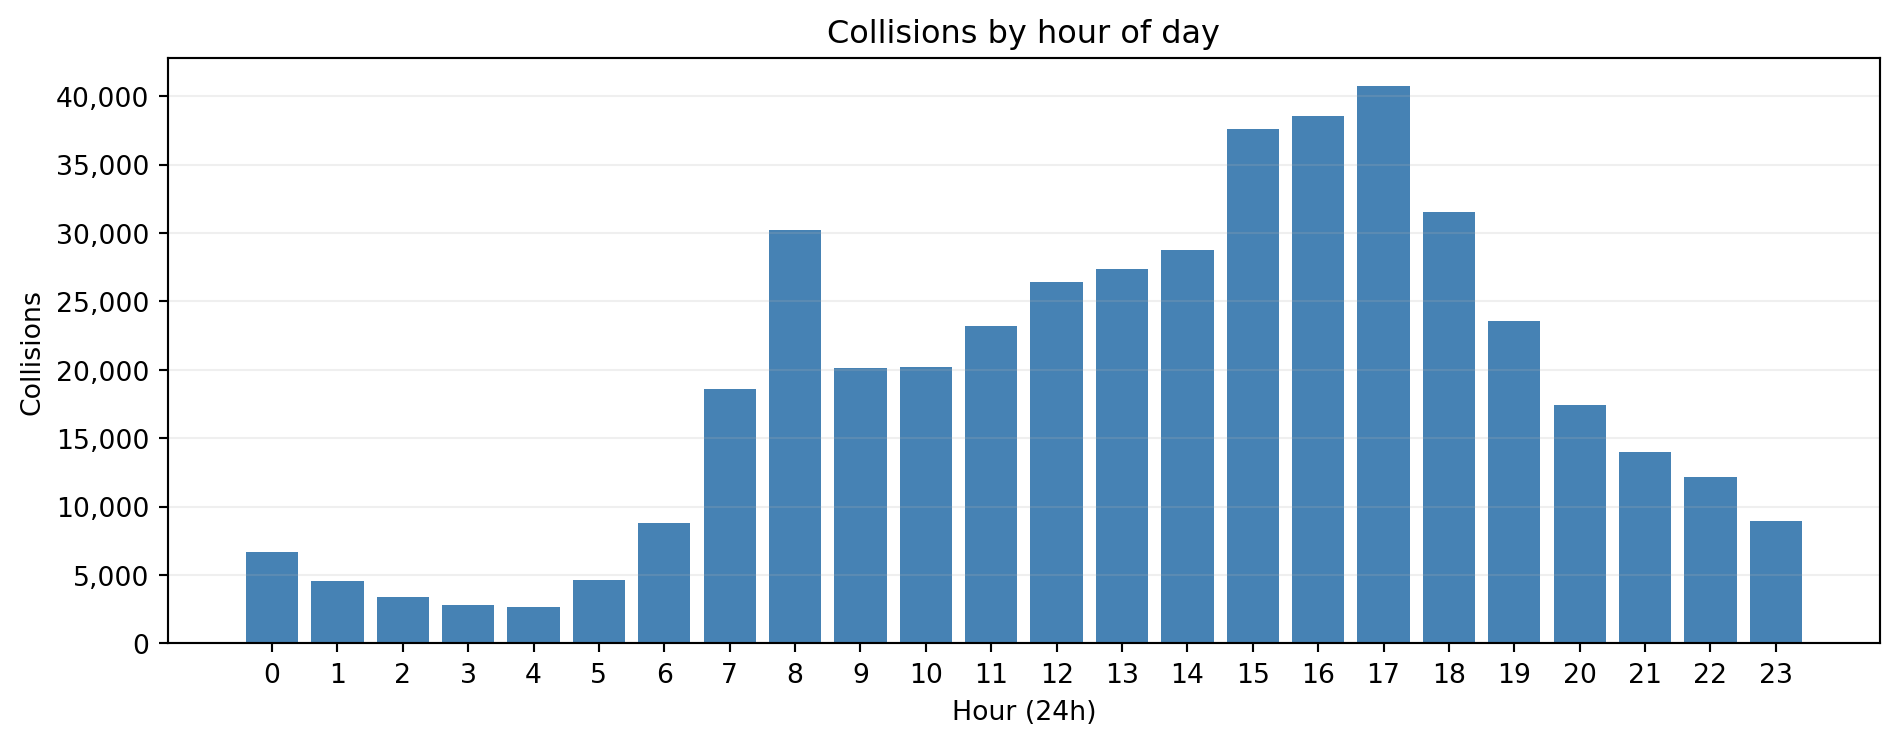
3.2 By hour of day
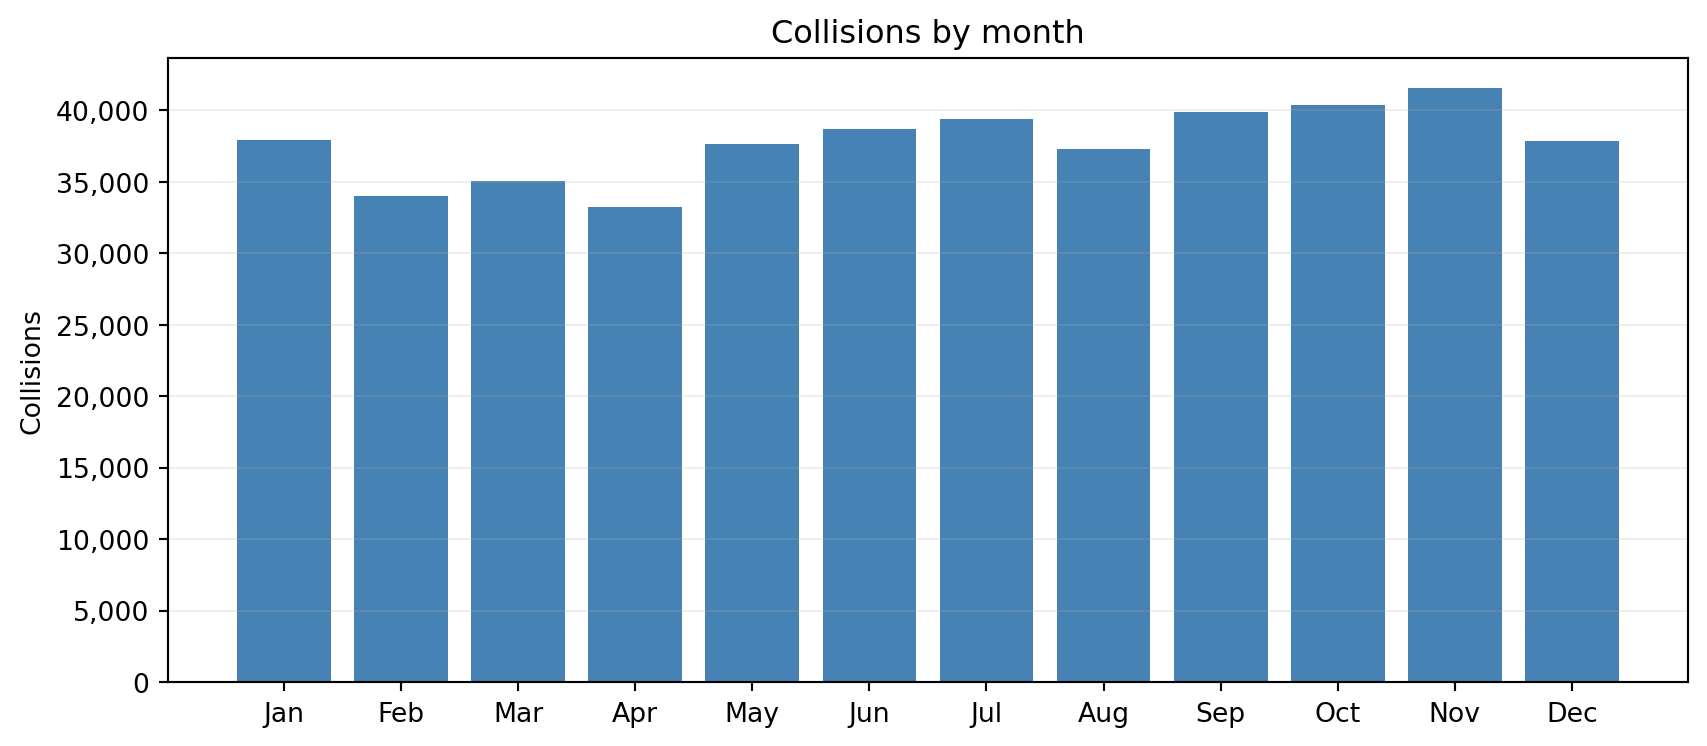
3.3 By month
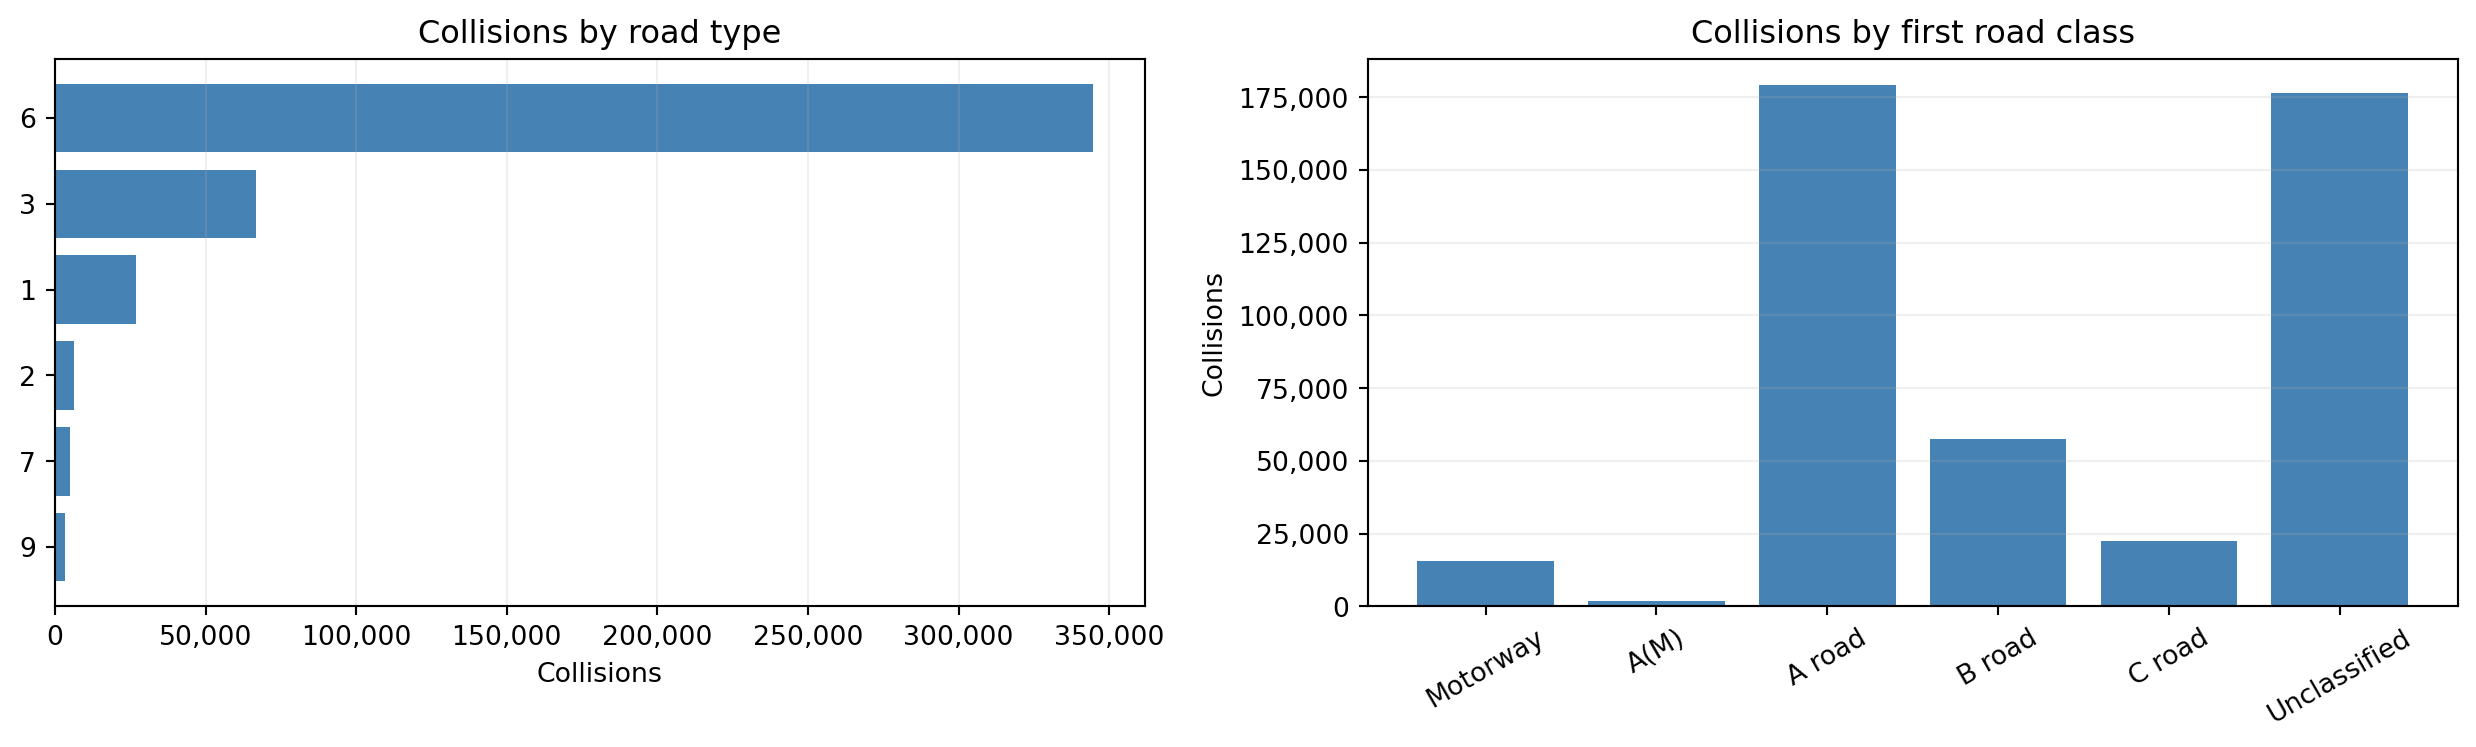
4 Road context
4.1 Road type and class
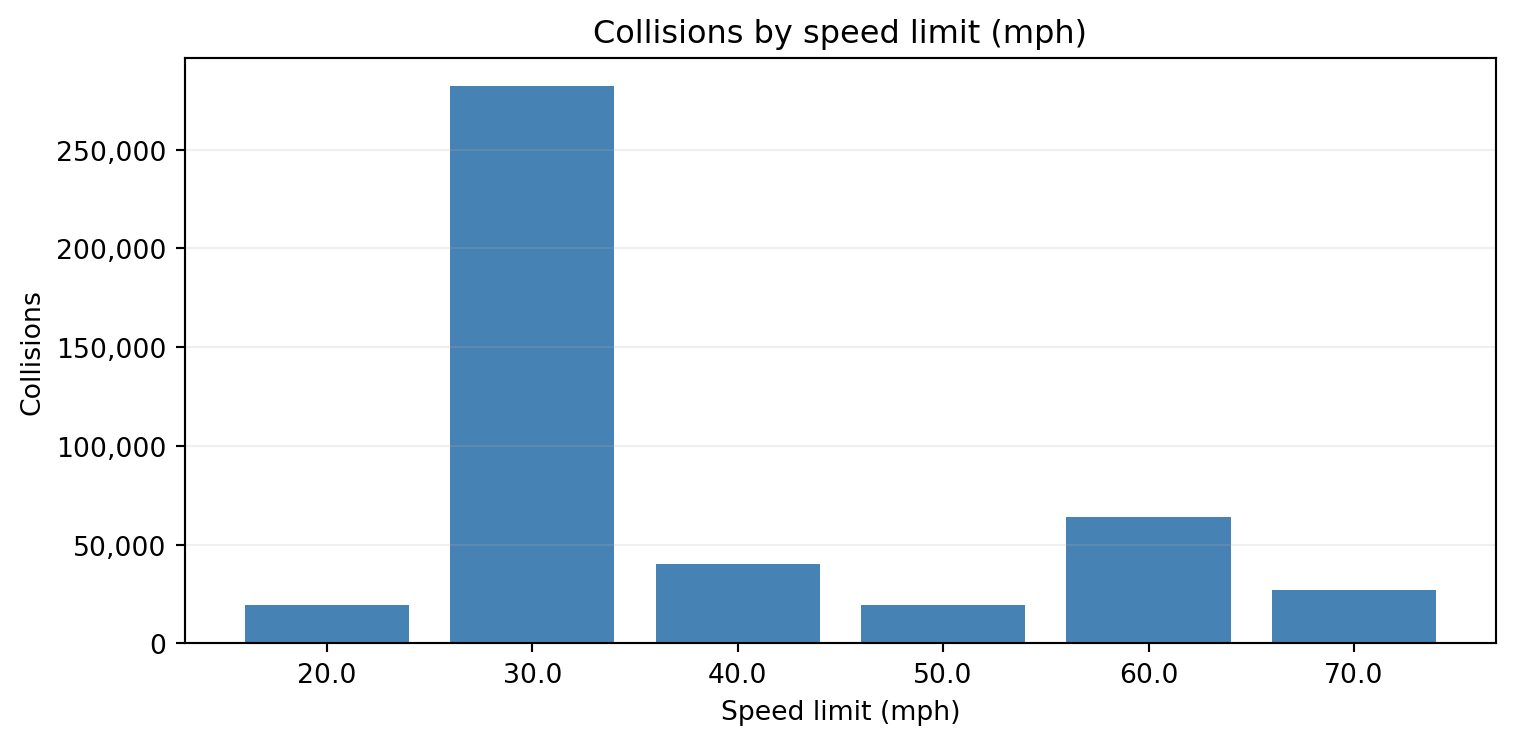
4.2 Speed limit
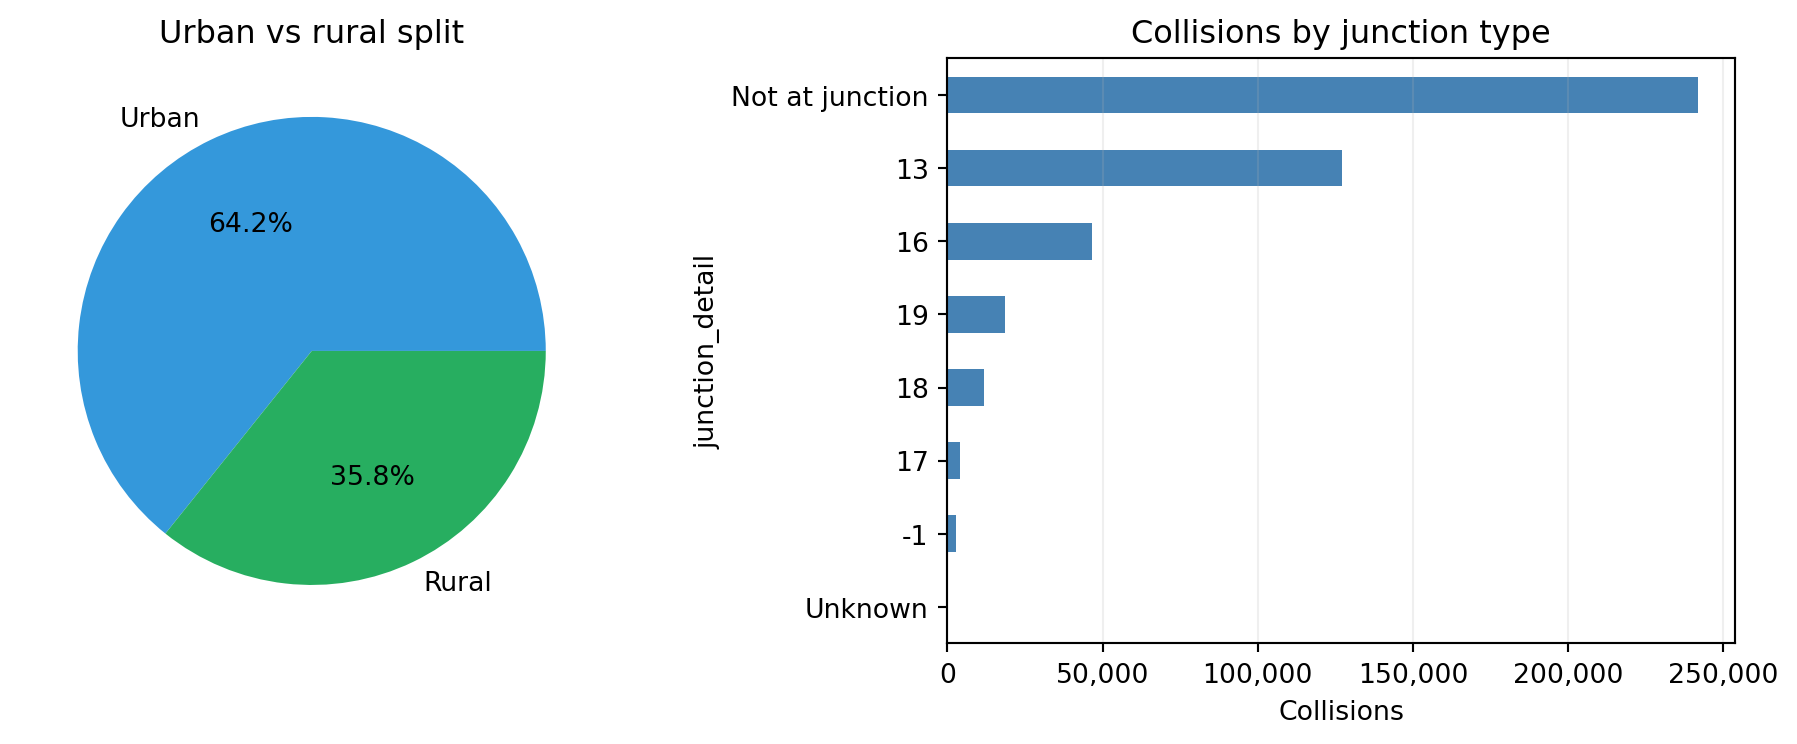
4.3 Urban vs rural and junction context
5 Light conditions
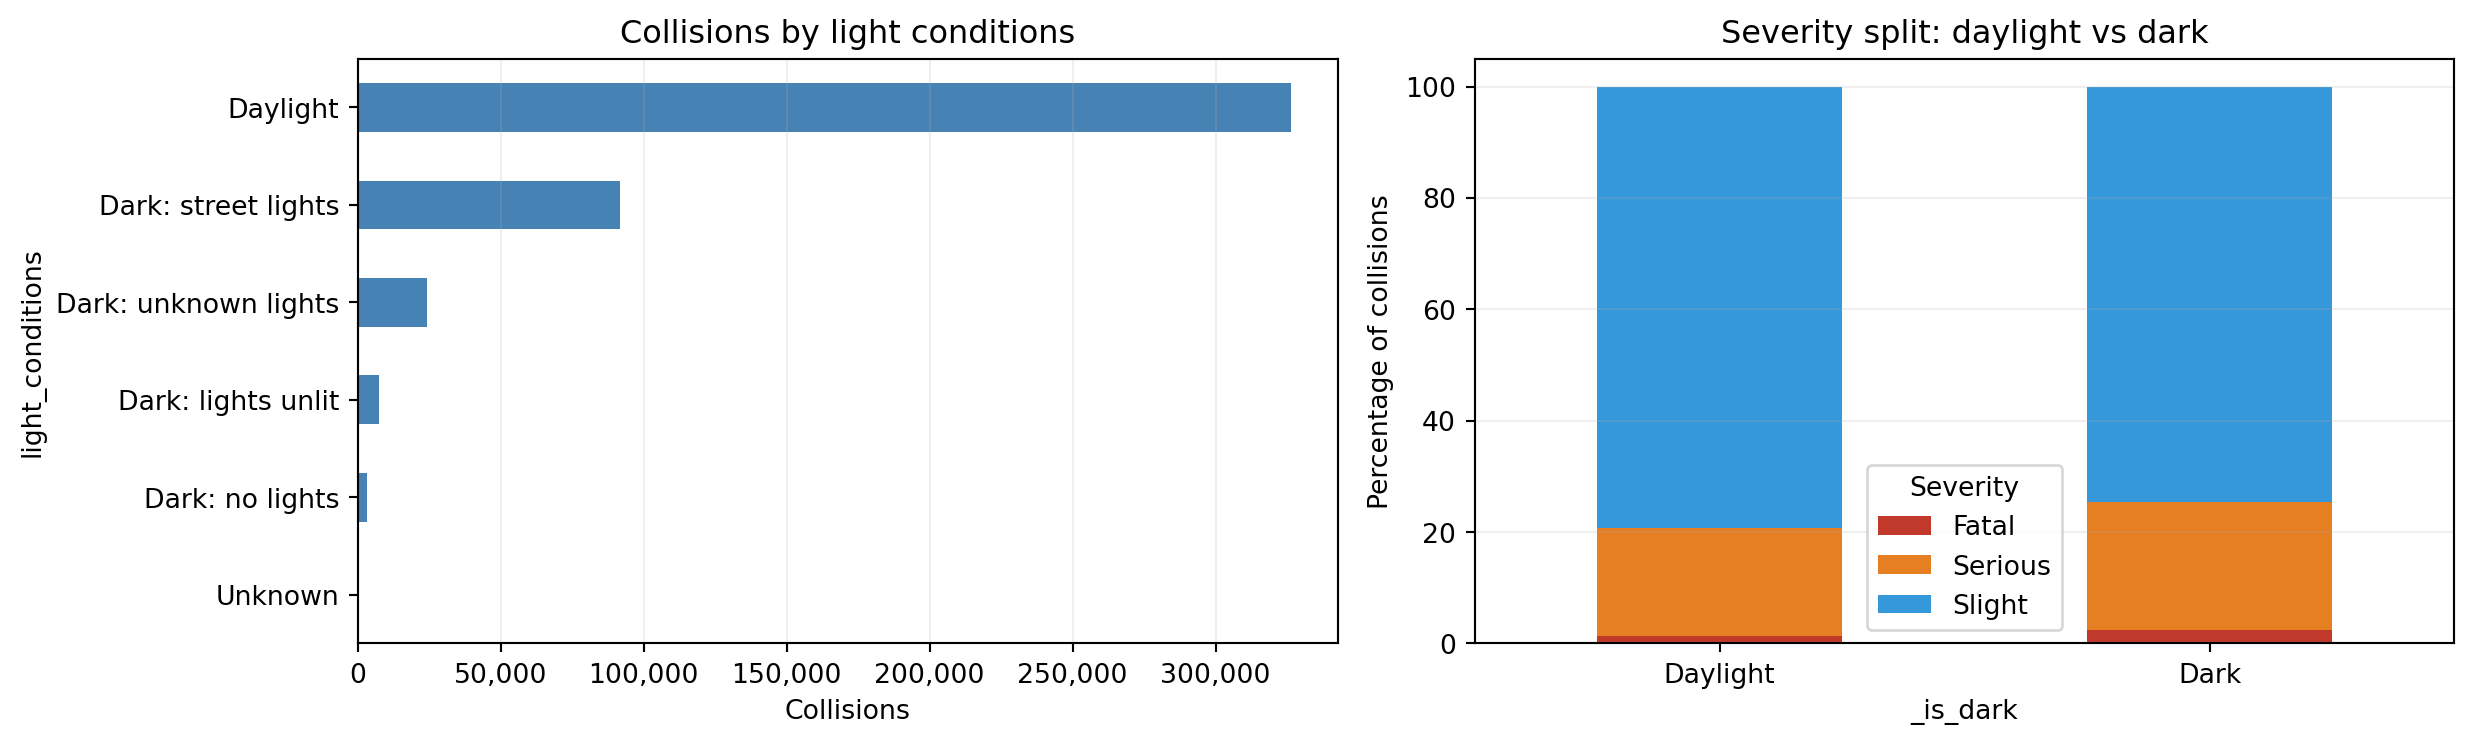
Dark collisions: 126,529 (27.9% of total)6 Coordinate quality
  Coordinate quality:
    coords_valid=True   : 452,310
    coords_valid=False  : 587
    coords_suspect=True : 484 (>10 km from LSOA centroid)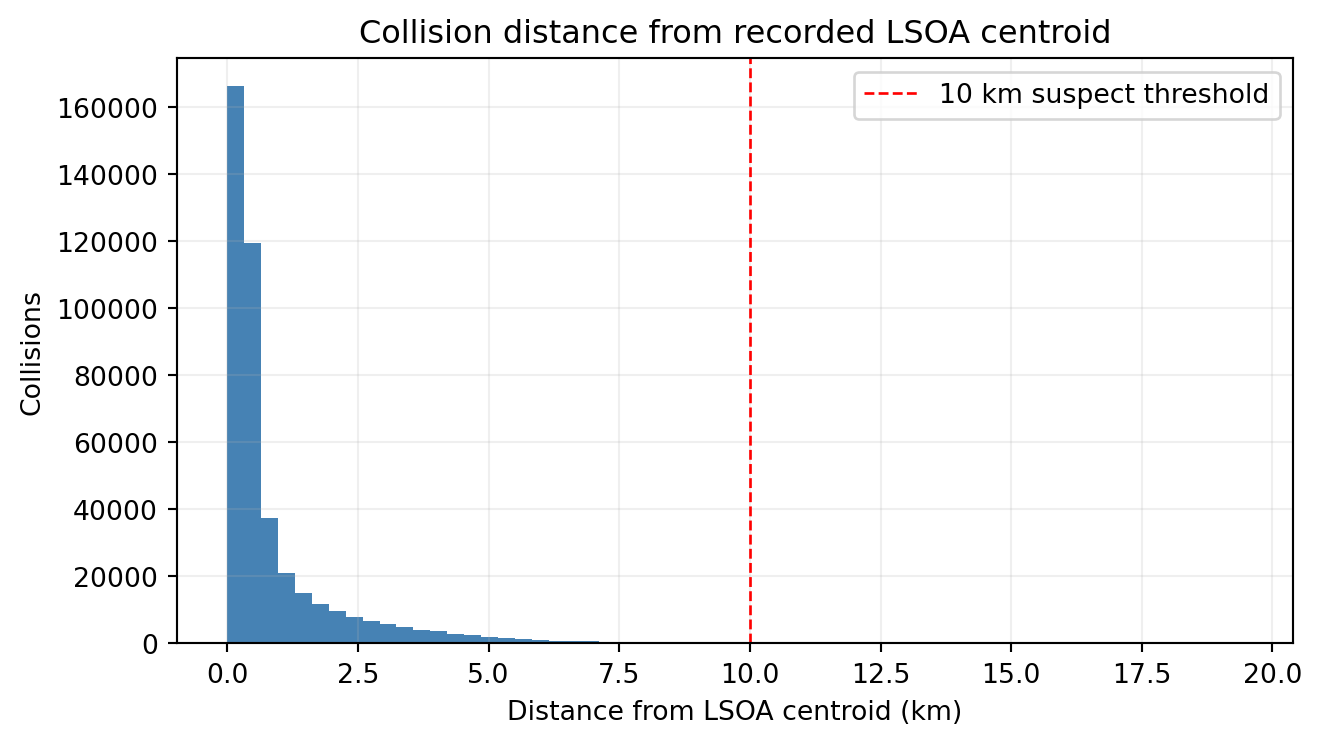
7 Key observations
Total collisions analysed : 452,897
Fatal collisions          : 7,451 (1.6%)
Dark conditions           : 126,529 (27.9%)
Urban setting             : 290,929 (64.2%)
Not at junction           : 241,733 (53.4%)
Note
These raw proportions describe the collision dataset, not collision risk. Risk requires dividing by exposure (vehicle-kilometres). Roads with high urban or junction proportions may look dangerous here but score differently after the exposure model is applied in Stage 2.